Climate and Weather Charts
Liverpool John Lennon Airport (LPL)
(Liverpool, England)

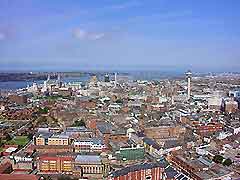
Liverpool features a changeable, temperate climate and can be found in the county of Merseyside, on the northwestern coast of England. The weather here is influenced by its appealing waterfront setting, standing alongside the River Mersey, close to the Liverpool Bay and nearby Irish Sea.
Temperatures in Liverpool peak during July and August, regularly exceeding 20°C / 68°F or more, although the weather at this time of the year can prove somewhat unpredictable, with heavy downpours at times. However, the climate during Liverpool's summer months is generally favourable and this is the most popular time to visit the city, with both spring and autumn also offering mild weather and plenty of fine, sunny days. The average annual daytime temperatures in Liverpool are around 13°C / 55°F.
Climate Description: Changeable, temperate climate
Liverpool John Lennon Airport (LPL) Location: Northern Hemisphere, England
Annual High / Low Daytime Temperatures at Liverpool: 20°C / 6°C (68°F / 43°F)
Average Daily January Temperature: 6°C / 43°F
Average Daily June Temperature: 17°C / 63°F
Annual Rainfall / Precipication Liverpool at Airport (LPL): 775 mm / 31 inches
Liverpool John Lennon Airport (LPL):
Climate and Weather Charts
Temperature Chart |
| Temperatures |
Jan |
Feb |
Mar |
Apr |
May |
Jun |
Jul |
Aug |
Sep |
Oct |
Nov |
Dec |
Average |
Maximum
Celcius (°C) |
6 |
7 |
9 |
11 |
15 |
17 |
20 |
18 |
16 |
13 |
10 |
8 |
13 |
Minimum
Celcius (°C) |
2 |
3 |
4 |
5 |
7 |
10 |
14 |
12 |
11 |
8 |
5 |
4 |
7 |
Maximum
Fahrenheit (°F) |
43 |
45 |
48 |
52 |
59 |
63 |
68 |
64 |
61 |
55 |
50 |
46 |
55 |
Minimum
Fahrenheit (°F) |
36 |
37 |
39 |
41 |
45 |
50 |
57 |
54 |
52 |
46 |
41 |
39 |
45 |
Rainfall / Precipitation Chart |
| Rainfall |
Jan |
Feb |
Mar |
Apr |
May |
Jun |
Jul |
Aug |
Sep |
Oct |
Nov |
Dec |
Total |
| Rainfall (mm) |
71 |
53 |
53 |
43 |
51 |
51 |
56 |
74 |
71 |
89 |
84 |
79 |
775 |
| Rainfall (inches) |
2.8 |
2.1 |
2.1 |
1.7 |
2.0 |
2.0 |
2.2 |
2.9 |
2.8 |
3.5 |
3.3 |
3.1 |
31 |
Seasonal Chart |
| Seasons |
Average
Temp
(Max °C) |
Average
Temp
(Min °C) |
Average
Temp
(Max °F) |
Average
Temp
(Min °F) |
Total
Rainfall
(mm) |
Total
Rainfall
(inches) |
| Mar to May (Spring) |
12 |
5 |
53 |
42 |
147 |
6 |
| Jun to Aug (Summer) |
18 |
12 |
65 |
54 |
181 |
7 |
| Sept to Nov (Autumn / Fall) |
13 |
8 |
55 |
46 |
244 |
10 |
| Dec to Feb (Winter) |
7 |
3 |
45 |
37 |
203 |
8 |
 Liverpool features a changeable, temperate climate and can be found in the county of Merseyside, on the northwestern coast of England. The weather here is influenced by its appealing waterfront setting, standing alongside the River Mersey, close to the Liverpool Bay and nearby Irish Sea.